
You Have Monitoring—Do You Also Need Observability?
Monitoring and observability can in some ways be compared to virtual machines (VMs) and containers: they share much in common, but have important differences that are important to understand.
In the case of VMs and containers, they’re both methods of abstraction that allow portability of applications and hardware agnosticism, and they both also serve as security boundaries. These distinctions are generally well known in the IT community. In the case of monitoring and observability, however, the differences are not as well understood.
Monitoring a system and observing a system, although related, are different things. Monitoring tells you when something goes wrong by using a set of baseline metrics that are triggered by an anomaly. Observability is often defined as “the ability to infer a system’s internal states.” In a sense, monitoring relies on observability.
It can help to use another analogy. Monitoring is like the smoke detector’s siren, telling you that there’s a fire somewhere nearby. Observability, on the other hand, is like the safety inspector who examines your circuit breaker panel—if the inspector was watching the system 24/7, without a break. The electrical box accepts the main power from your utility company and distributes electrical current to the various circuits within your home or business, which are marked on the breaker panel. This panel shows how the wiring works, and where the electricity goes. In other words, it provides a blueprint for your electrical infrastructure.
The inspector can see the underpinnings from this, and can dig deeper to discover weaknesses in the system. This can uncover potential trouble spots beforehand, or determine the cause of a fire after the fact. In the same way, observability tells you what’s going on behind the breaker panel, providing a comprehensive view of the overall system.
In contrast, monitoring alerts you when something goes wrong—the siren blast. It can provide clues as to the cause, but is limited in scope, being more concerned with “what happened” than “why it happened.” Most of the IT focus used to be on monitoring, but that’s evolving to put more weight on observability. This change is largely due to the increasing emphasis on cloud-native development and its related technologies like DevOps.
This is also reflected in spending on monitoring and observability. An article by O’Reilly notes that growth in observability in the past year is up 128%, while monitoring growth is up by just 9%. One result of this shift is that companies that focus on observability, like Honeycomb, are also doing well. Honeycomb just closed a $50 million round of funding, further demonstrating the climbing interest in observability.
This dovetails with current trends in software development, which is now largely built around microservices. Microservices chop up formerly monolithic apps into smaller, modular code segments that are highly portable and can live inside things like containers, which are being constantly destroyed and created. This movement of applications and data all over the place makes observability a crucial factor in ensuring that apps run smoothly, efficiently, and securely.
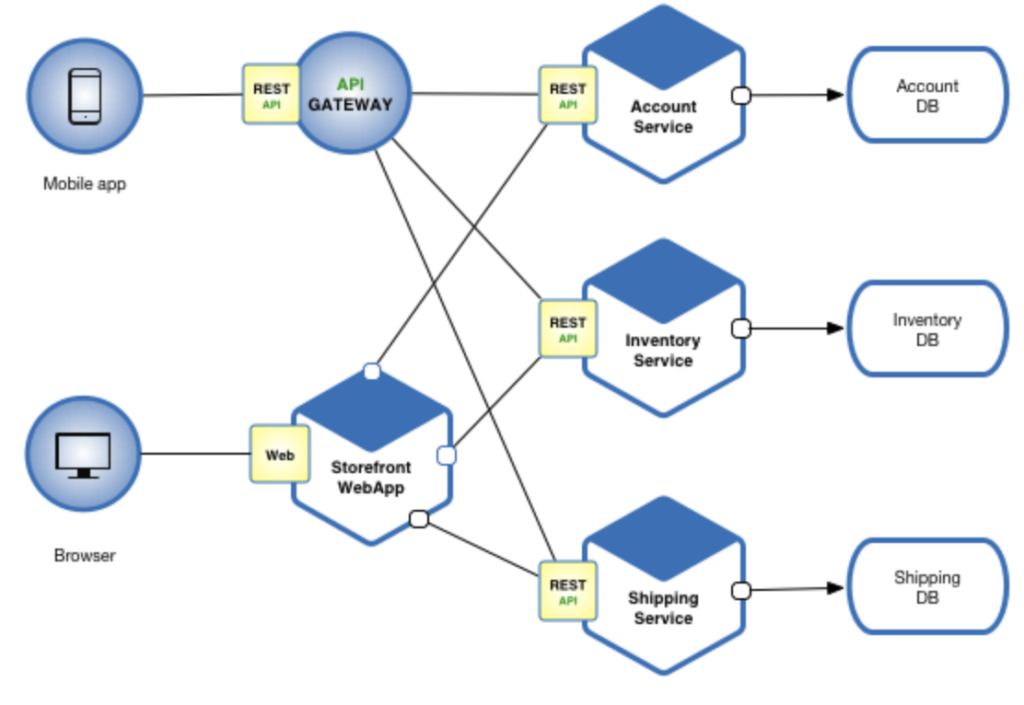
Observability was less important in the days of monolithic applications. “Way back when,” the classic three-tier application architecture—data tier, logic tier, presentation tier—had a limited number of servers, networks, and endpoints to traverse. This made troubleshooting a simple matter—at least compared to today’s model of cloud, multi-cloud, hybrid cloud (i.e., on-premises and public cloud), and edge computing environments.
An article in The New Stack explains that observability can answer some key questions for this modern, very complex microservices infrastructure, such as:
- What services did a request go through, and where were the performance bottlenecks?
- How was the execution of the request different from the expected system behavior?
- Why did the request fail?
- How did each microservice process the request?
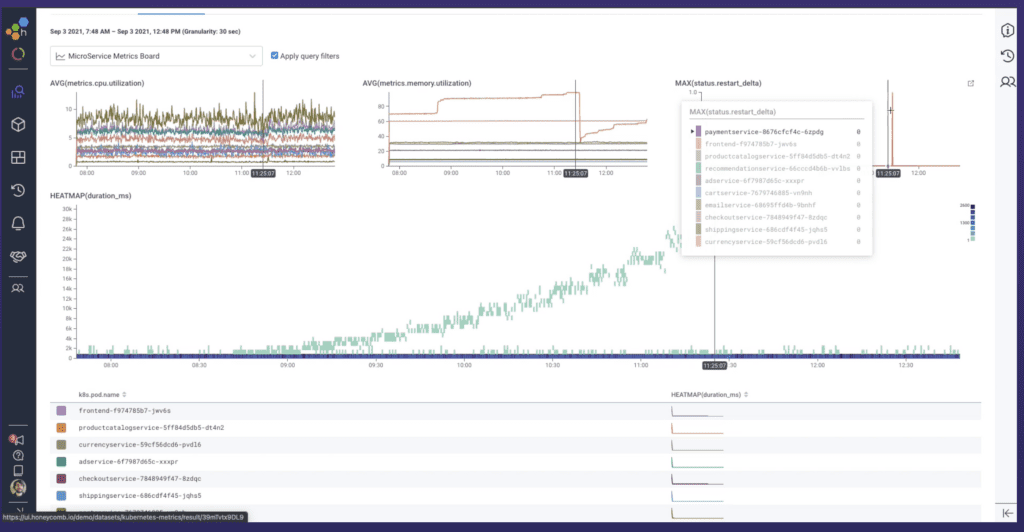
Since there can be hundreds or thousands (or more) of microservices for an app, the need for observability quickly becomes obvious. Look at Figure 2, for instance. It shows the Honeycomb dashboard for a typical microservices-based app, displaying latency metrics for the various Kubernetes pods in use. In this case, app latency ramped up at the same time as memory usage, and was fixed via a restart.
Observability and monitoring work together, but monitoring follows observability—you can’t monitor what you can’t see, after all. Monitoring may alert you that you’re overtaxing your servers or hammering your RAM, which is extremely useful information. But observability can pick apart your applications, showing, for instance, how well Kubernetes is working, and how efficiently your continuous integration/continuous deployment (CI/CD) pipeline is operating. This level of insight is becoming a requirement for properly managing an app’s full lifecycle.
This is in no way an indictment of monitoring, which every organization needs to be doing. But it’s no longer enough—it’s time to start adding observability to your operations. Without it, those smoke detectors will keep going off, and you may not have any idea that the problem is a faulty circuit breaker that doesn’t trip, causing a fire that destroys your kitchen. Honeycomb and other companies moving observability forward are doing crucial, cutting-edge work that deserves a closer look.